How people find, understand, and use information is critical to the success of scientific research, especially research in the health sciences. Thus the visualization of information is vital to scientific research. By being involved from the beginning of a research project, designers can help shape research concepts, develop processes, and interpret outcomes through the choice of words, typeface, images, media, etc. – from grant proposals to the data received by researchers to the interaction between care providers and patients, the shape of information.
The following are one example of scientific information visualization: diagrams for grant proposals and diagrams/data display from conference presentations. I developed these diagrams through conversation with scientists – where we were literally drawing and writing together – that visualize the relationships between ideas, processes, and people. I was a co-investigator for each proposal and co-presenter for each conference presentation.
Grant proposal diagrams
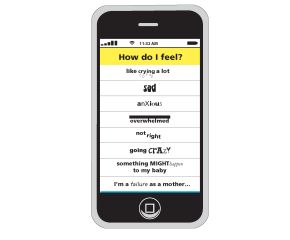
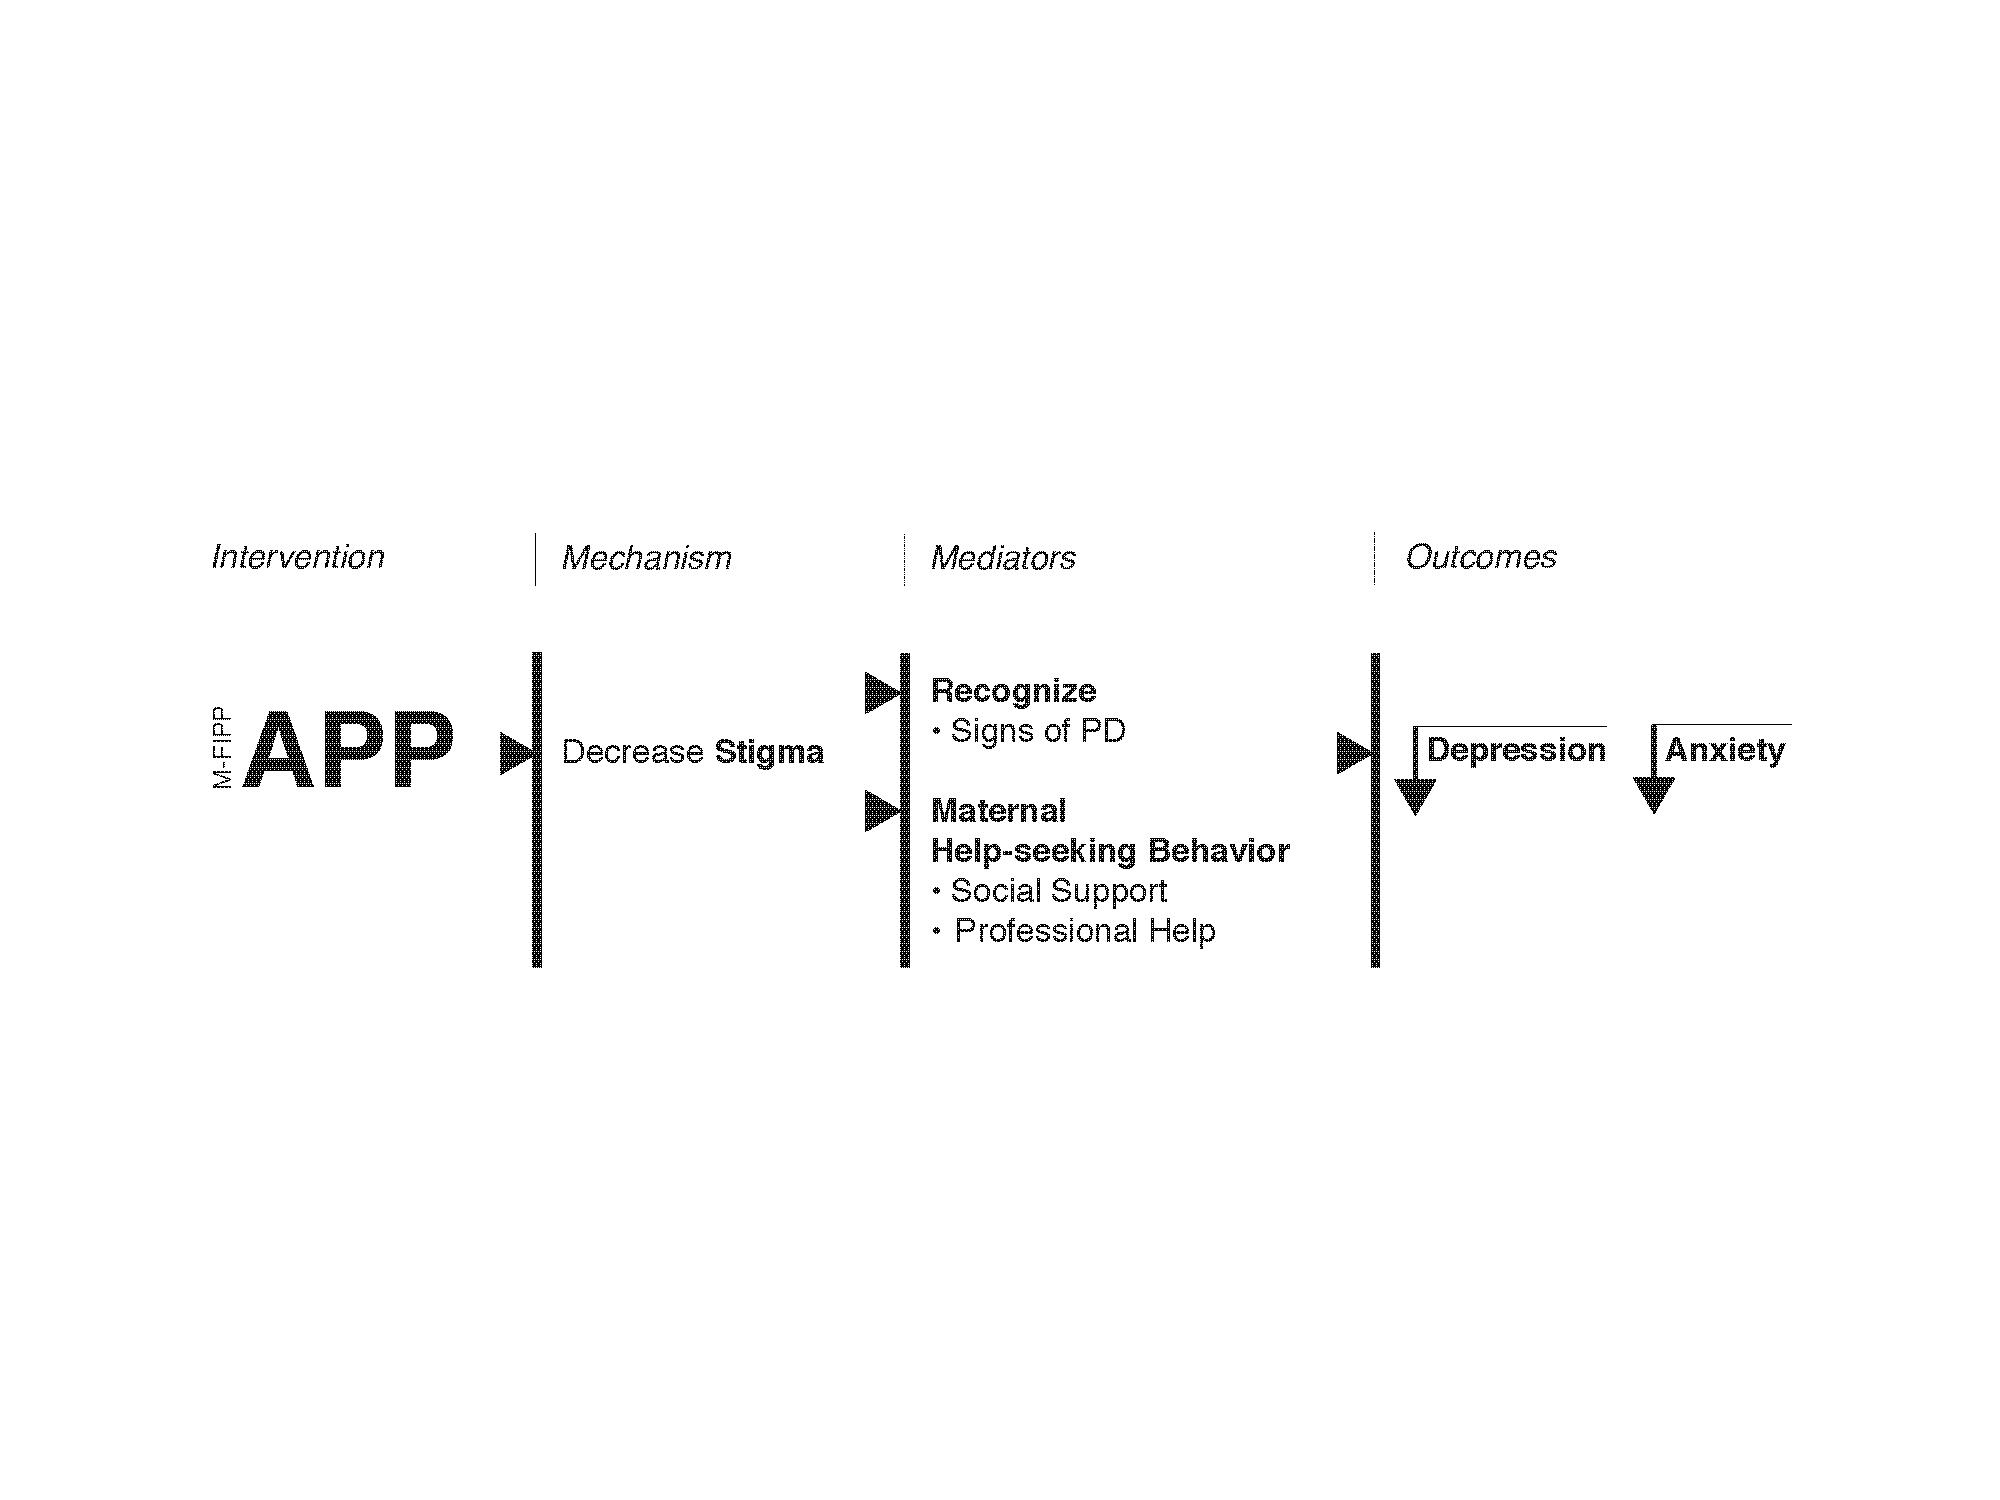
M-FIPP: A mobile device app for women at risk for perinatal depressive symptoms
NIMH; R34
2012
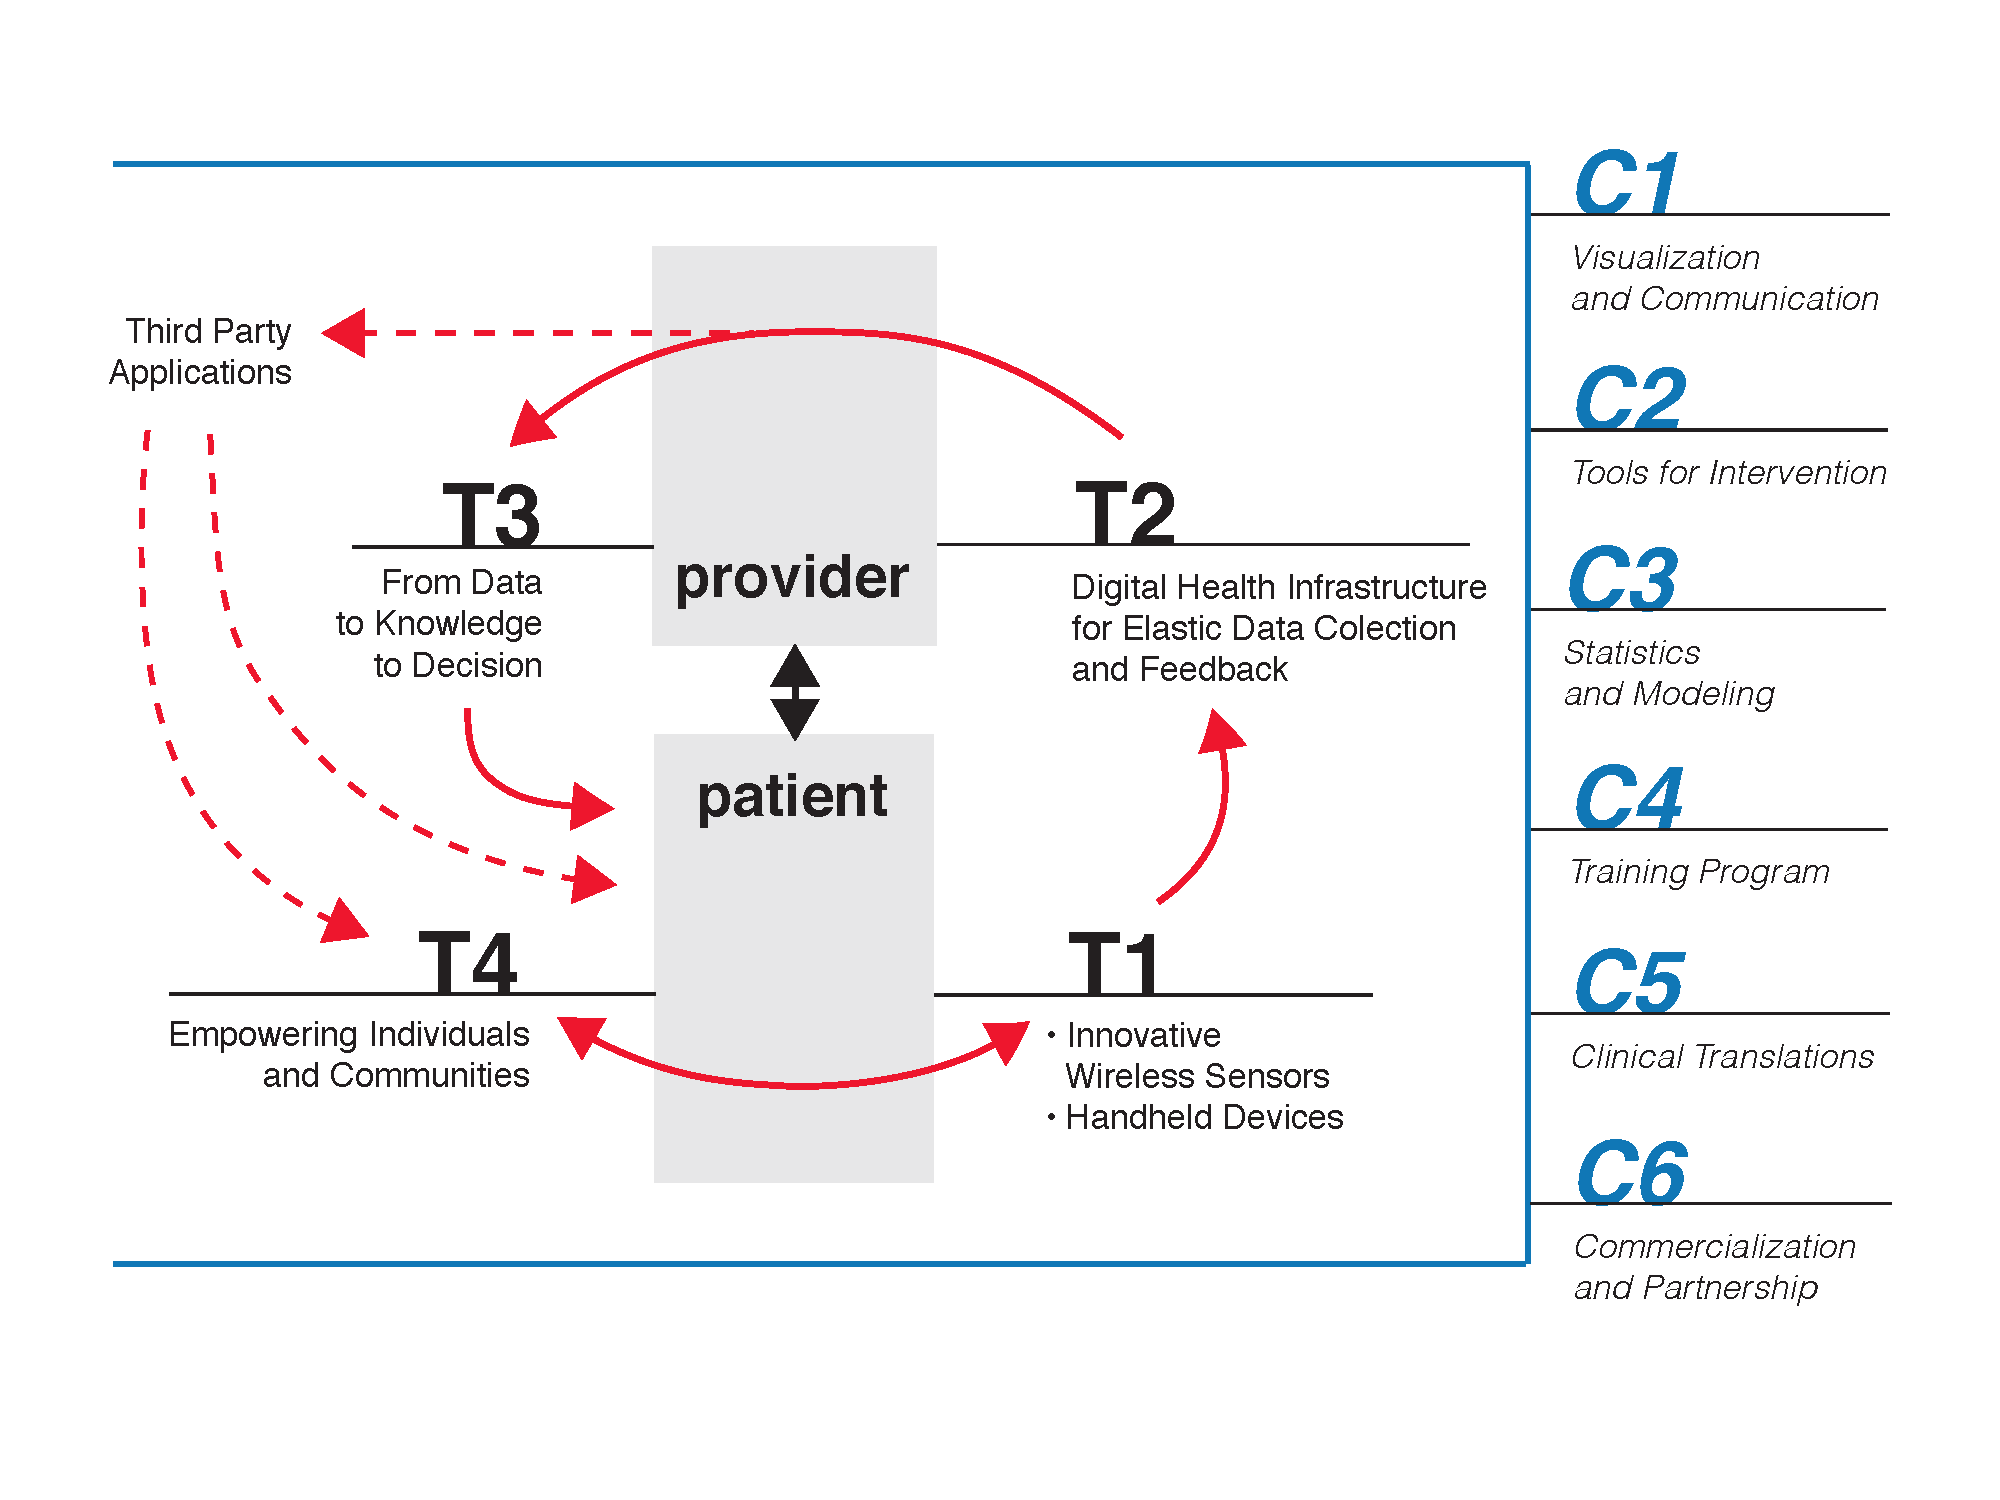
CWH: A Proposal for the Formation of the Center for Wireless Health
WSU Multidisciplinary Research Group Incubator
2013
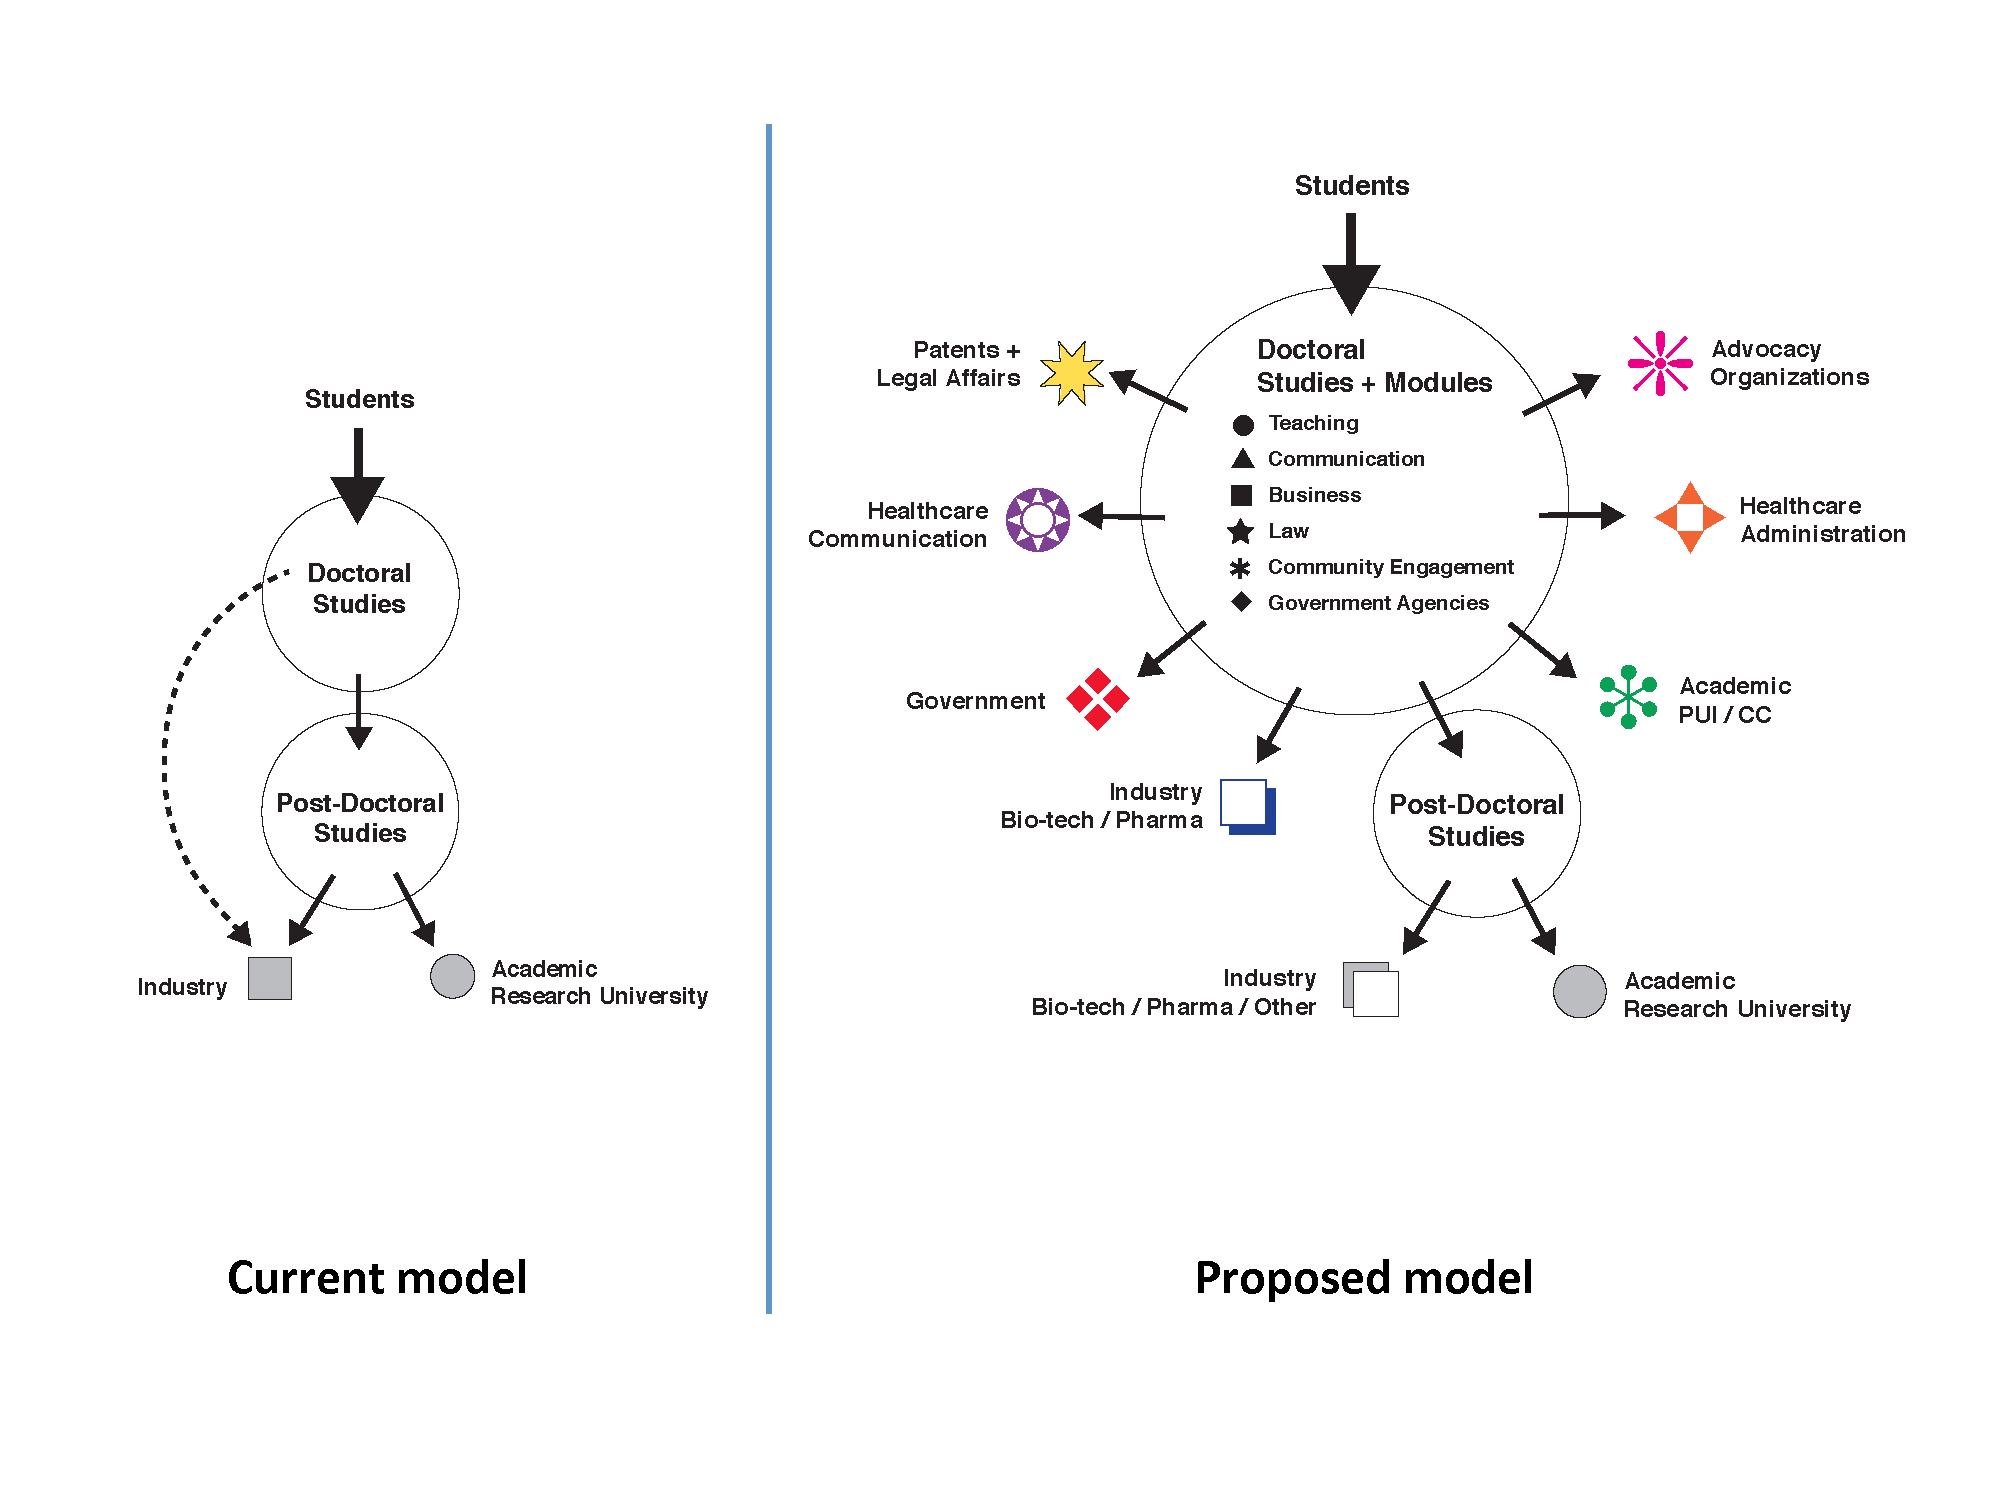
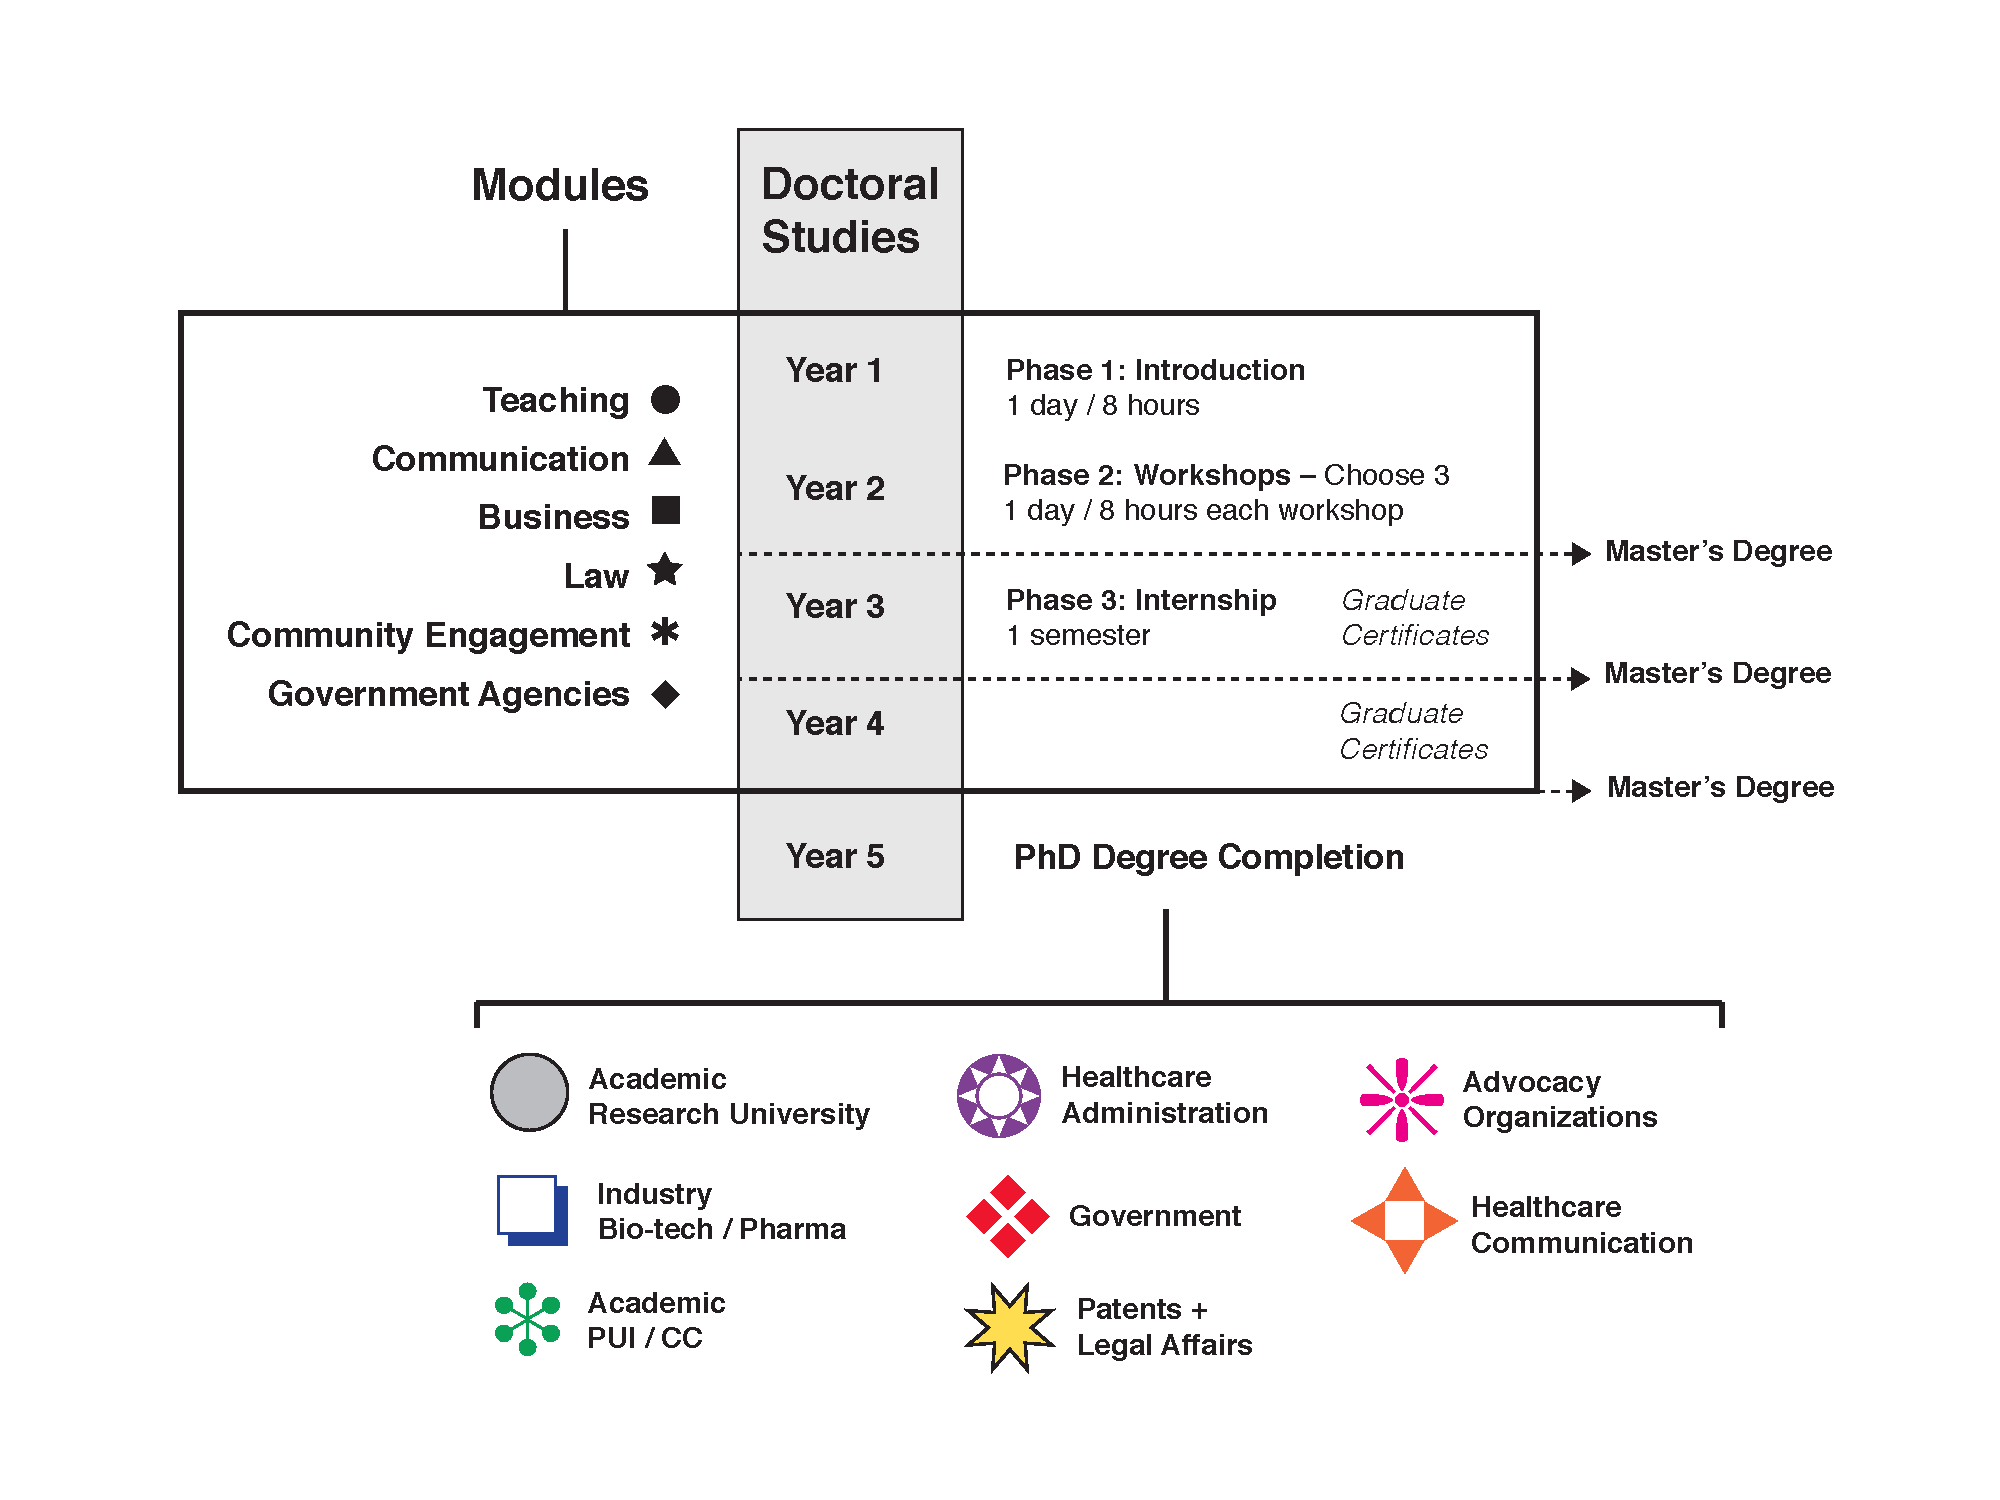
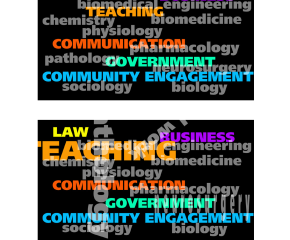
Wayne State University – Broadening Experiences in Scientific Training (BEST)
NIH; NIH Directors Biomedical Research Workforce Innovation Award
2013; awarded (5-years, $1.85 M)
- Current and proposed models
- Proposed program structure
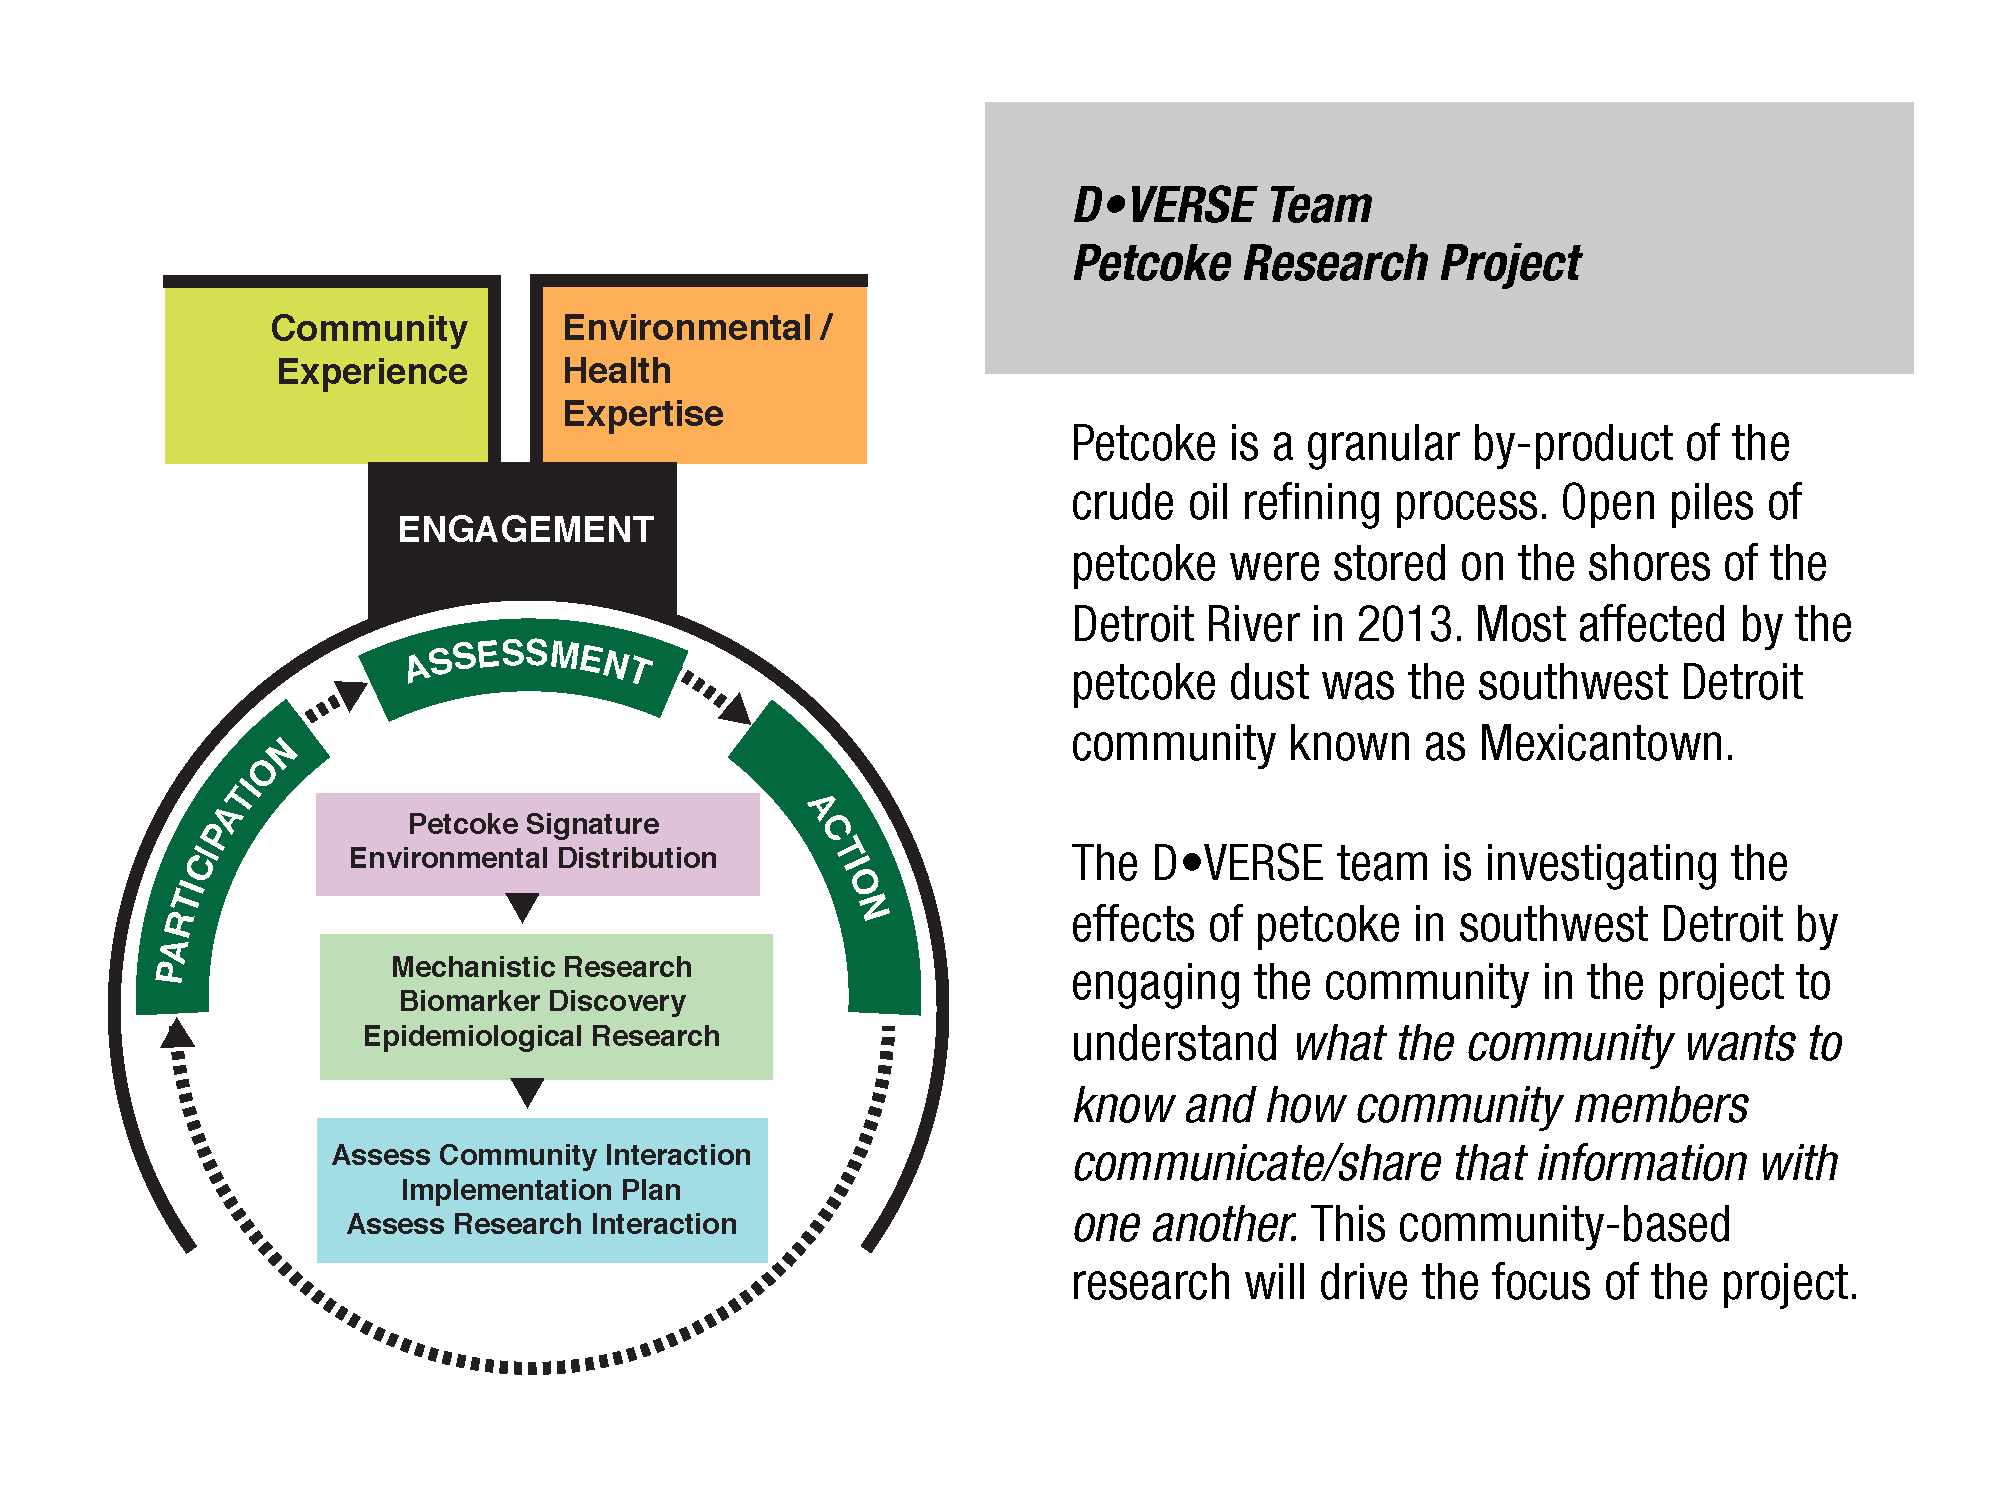
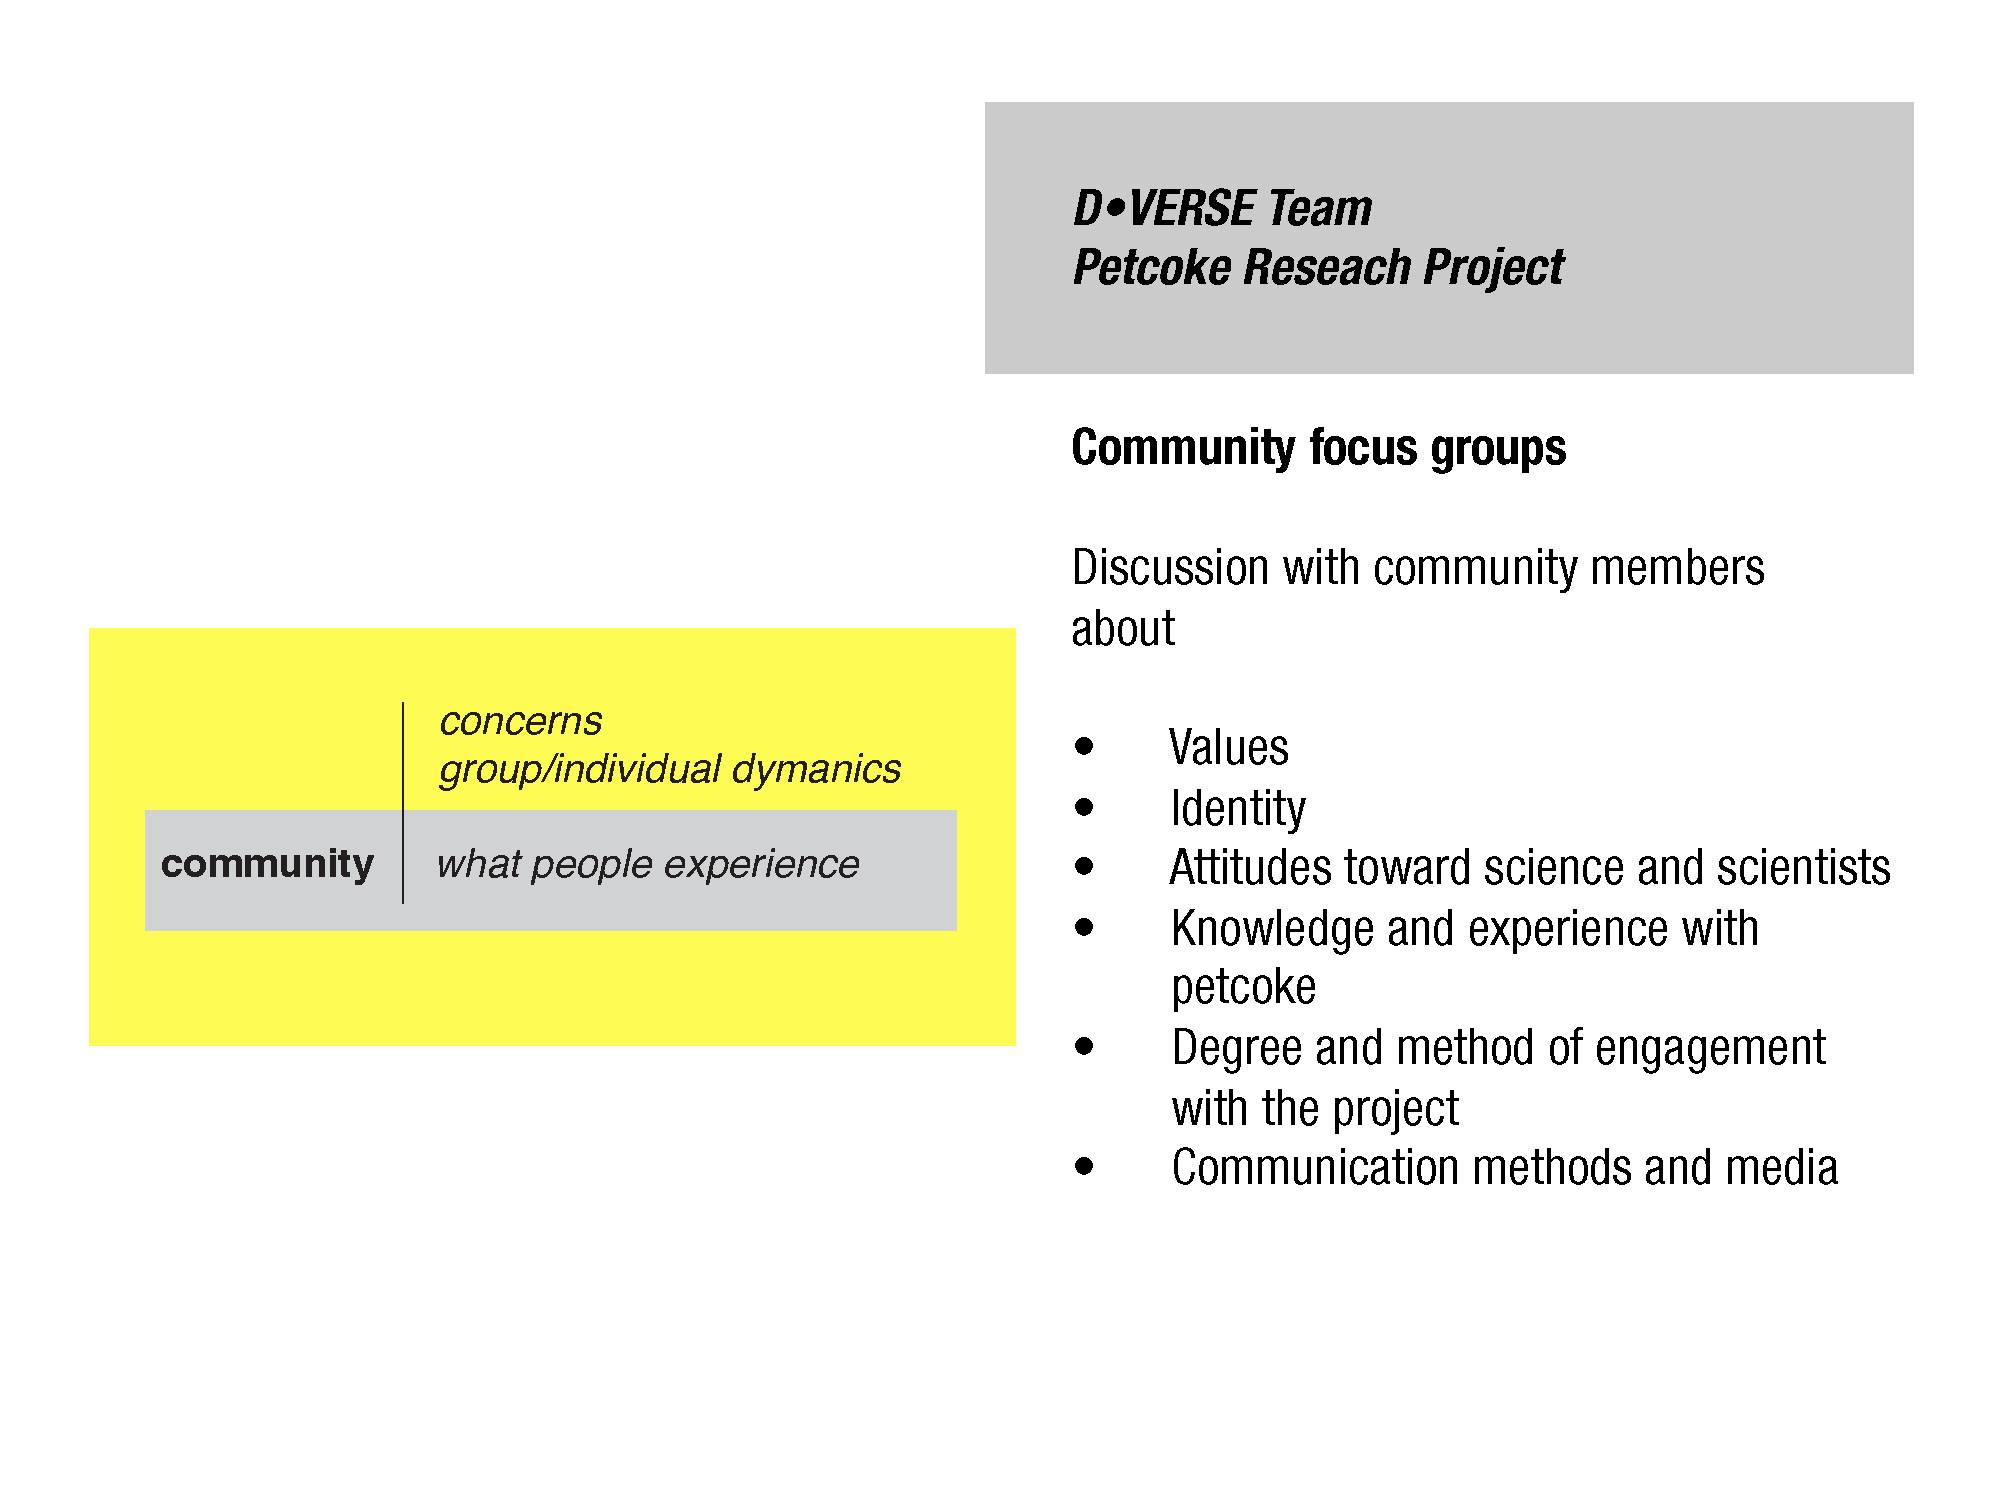
Petcoke in an urban environment: A community-based participatory model for assessing and communicating the impact of environmental stressors on public health and welfare
WSU Center for Urban Research on Environmental Stressors (CURES); D•VERSE team
2014; awarded (2.5-years, $150,000)
- In-process diagrams
- Final grant diagram
Click to download: grant application diagrams 3
Conference presentations
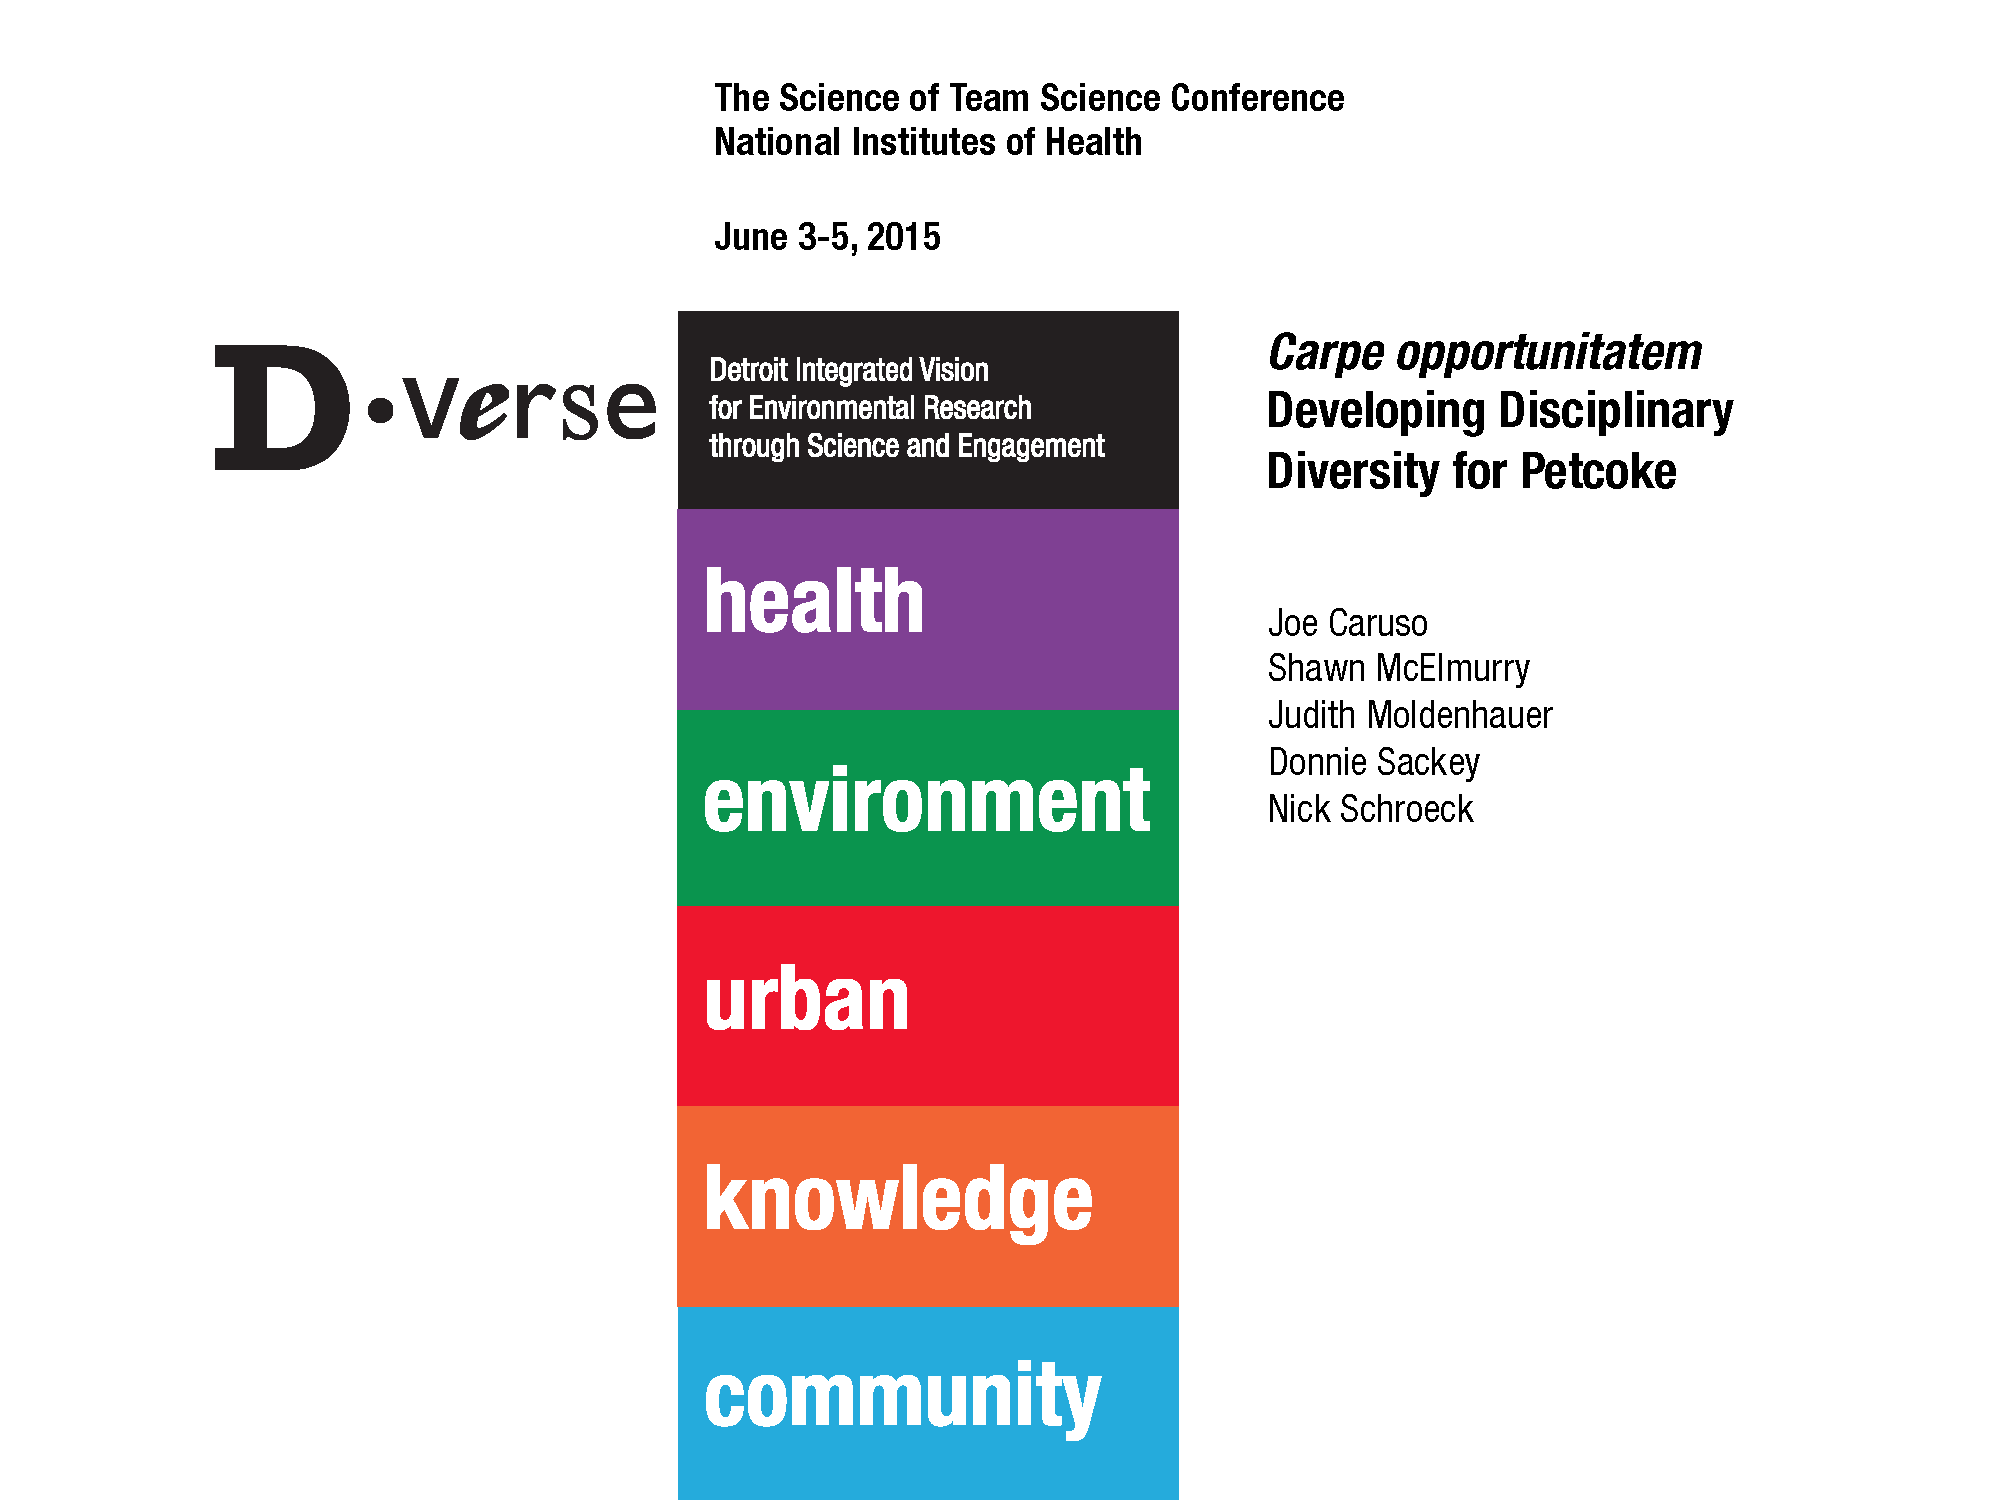
“Carpe opportunitatem: Developing Disciplinary Diversity for Petcoke,” The Science of Team Science Conference, National Institutes of Health, Washington, D.C.
2015
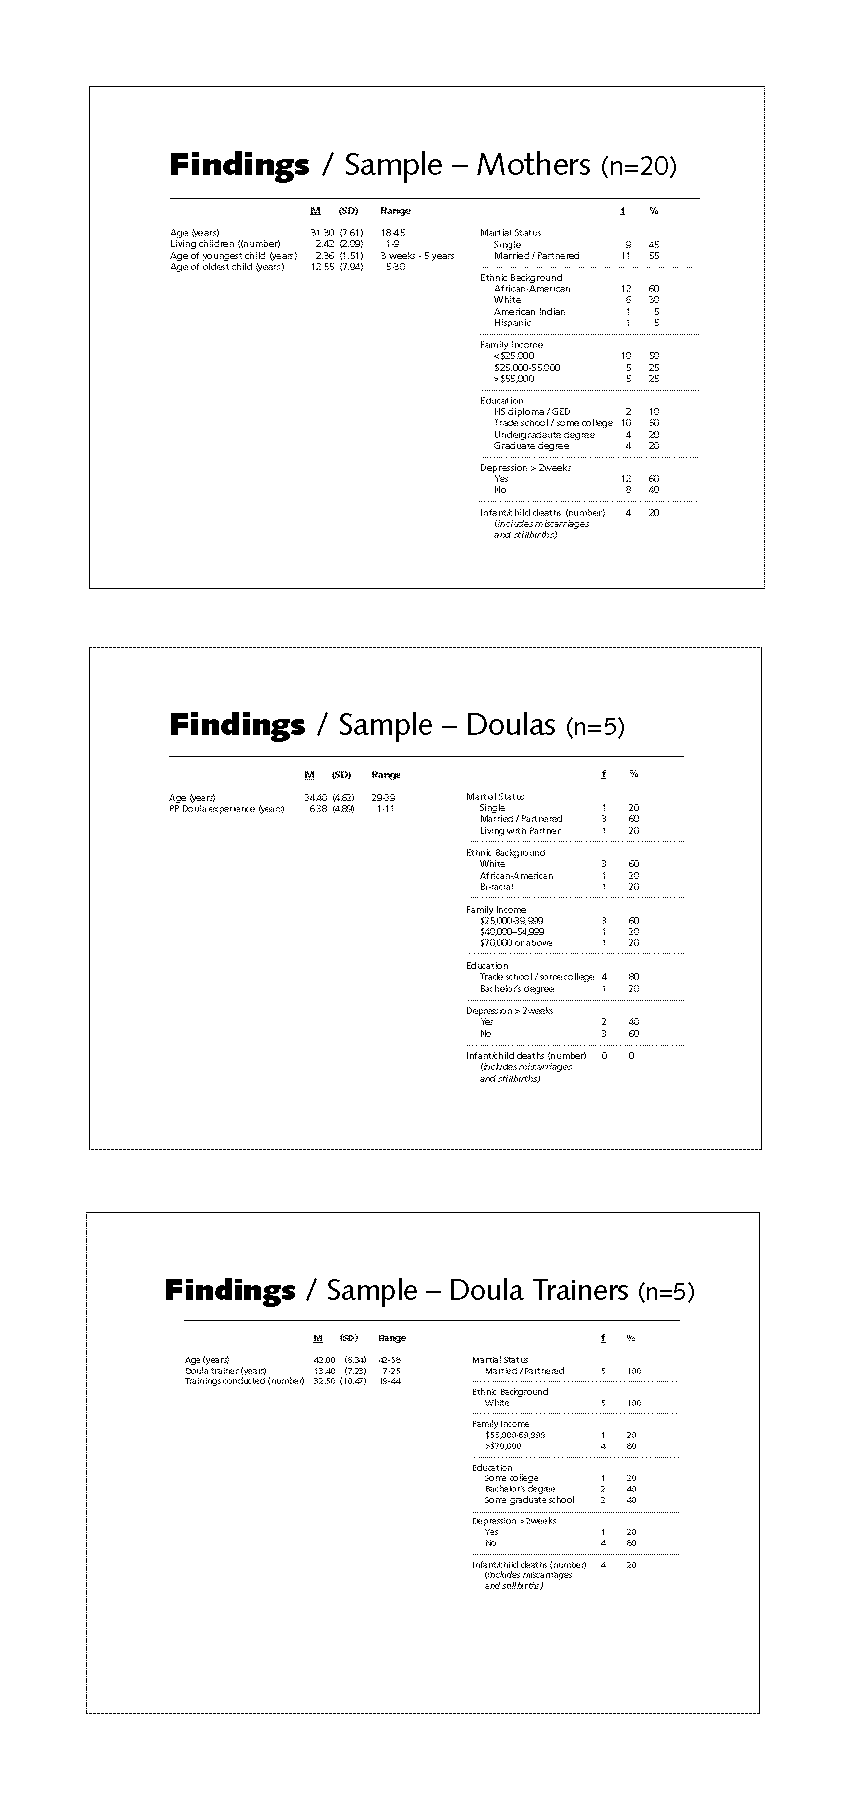
“Developing a Doula Intervention for Postpartum Depressive Symptoms” American Psychiatric Nurses Association (APNA) conference, Anaheim, California
2011
Click to download: conference presentations diagrams and visual displays
Other Items
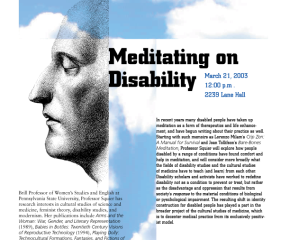
US FIPSE grant – visiting lecture poster
NIH WSU BEST program